Tools input
Input for the tools is a layer with tectonic orientations in ArcMap. The source of this layer is shapefile. Attribute table must contain fields for dip and dip direction (double or integer type), optionally the type of structure and control point ID. Use Selection Tools in ArcMap to select features by attributes or by location. OATools work with this selection.
>>OATools Add-In GUIDE, click here!Plot in Azimuthal Projection
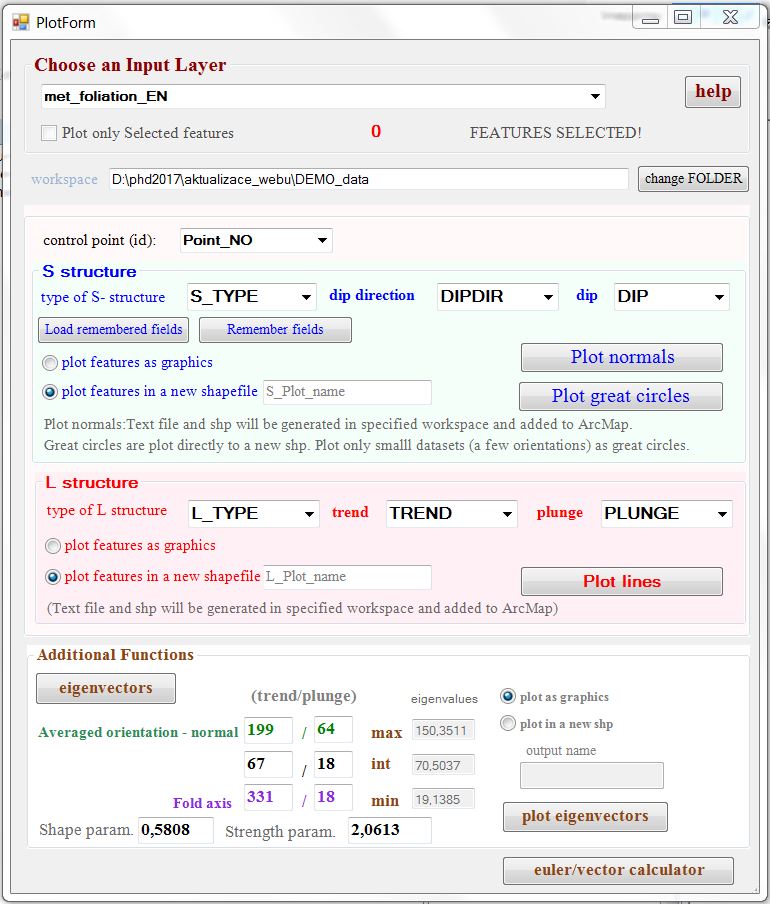
This tool plots tectonic orientations in an equal-area projection of lower hemisphere. Planes can be plotted as normals or great circles. Output is either graphical points or point shapefile with attribbutes.
There are additional functions. Eigenvectors can be computed, shape and strength parameters (*).
Points in the diagram can be linked with the original data by the Link Map and Projection tool so you can see their position in the map.
This tool also contains simple vector calculator.
(*) Fisher, N. I. – Lewis, T. – Embleton, B. J. J. (1987): Statistical Analysis of Spherical Data. – Cambridge University Press, Cambridge, 329pp.
Density Distribution Diagram
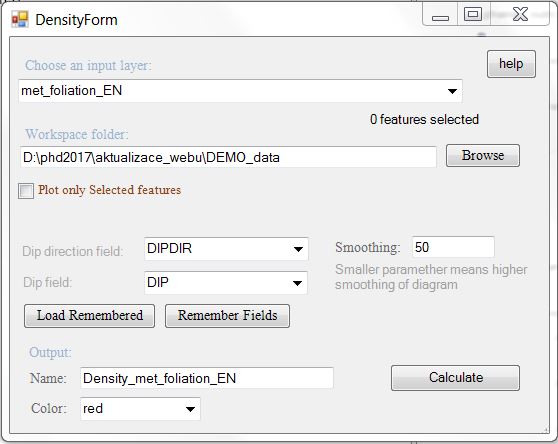
Density distribution diagram can be computed for large datasets. Watson density for axial data is calculated (*).
(*) Watson, G. S. (1983): Statistics on Spheres. – J. Wiley, New York, 238pp.Spatial Averaging
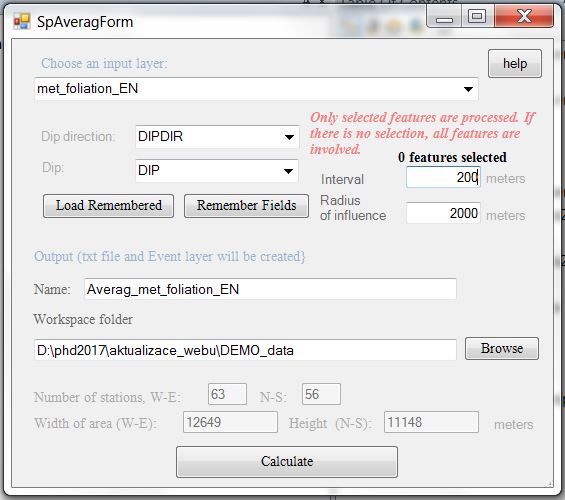
This tool calculates averaged orientation of axial data in a regular net of stations. Interval of stations is optional. Averaged orientation is calculated from orientation matrix, the highest eigenvalue is used to get the eigenvector. Only features within a given radius of influence are involved into the calculation. Their influence is weighted by the distance from averaging station.
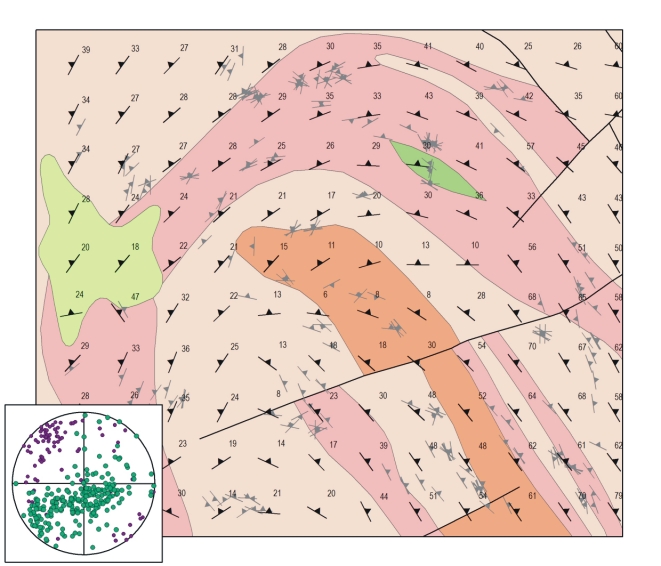
Map of Fold Axes
This tool is similar to the previous one, the calculation also works with orientation matrix, but the lowest eigenvalue is used. Therefore the result is the axis of folding represented by the trend and plunge. Rose Histogram
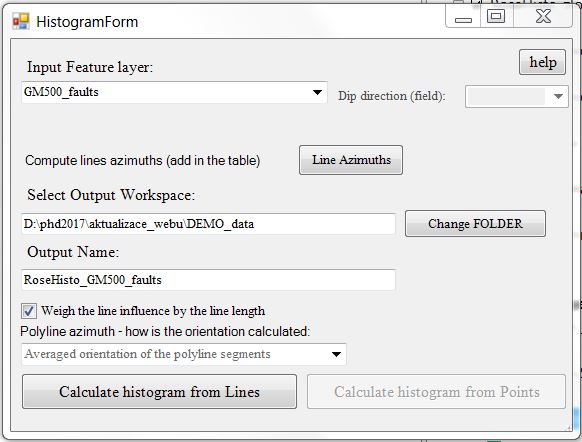
The rose histogram represents the frequency of orientations of geological structures. The input layer is a point or polyline shapefile. If it is a point shapefile, field with dip direction must be specified. Dip directions are then converted to strikes that are represented in the diagram. Orientation of polyline is calculated as a mean vector of the polyline segments orientations or orientation of straight line connecting the start and the end point of the polyline. Computed orientations can be optionally added to the attribute table. Orientations are matched to one of the 10 degrees classes. The class with the highest frequency is 100% of the diagram radius; other classes are relative to it. Diagram can be optionally weighted by the lines length.
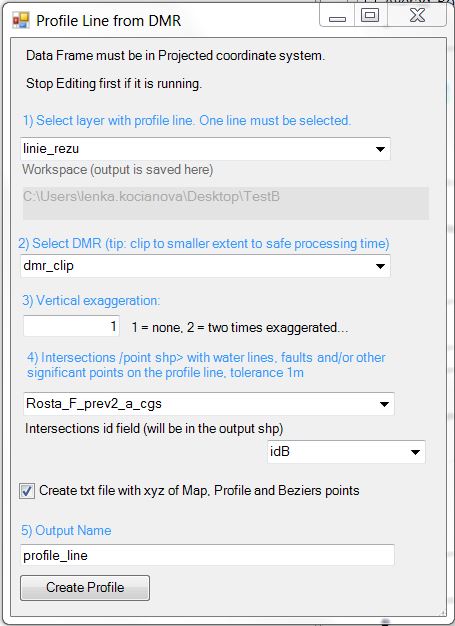 Cross Section Profile Line (CSProfile)
 This tool was added to the toolbar. More cross section tools are in the new extension (GeoSol Extension). CSProfile tool creates profile line of the cross section. Input is the Digital Elevation Model (DEM) and line shapefile with one line selected.
GO UP!