Závěrečná práce: Michaela Bajanová: Infographics Builder Application
Bakalářská práce
Infographics Builder Application
Anotace
Cieľom práce je implementovať open-source webovú aplikáciu určenú pre tvorbu infografiky a overiť túto aplikáciu na používateľoch. Aplikácia može byť použitá pre vizualizáciu dát, zmenu štýlu infografiky, zdieľanie, zobrazovanie a prezentovanie infografiky. Práca analyzuje implementovanú aplikáciu, rieši použité technológie, používateľské rozhranie a zaujímavé časti implementácie. Práca tiež vyhodnocuje používateľskú spätnú väzbu zbieranú pomocou dotazníka.
Abstract
The aim of this thesis is to implement an open-source web application designated for creating infographics and to verify the application on real users. The application can be used for visualizing data, customizing infographic style, sharing, viewing infographics, and presenting infographics. The thesis presents an analysis of the application, in addition to discussing used technologies, user interface …více
Zadání práce
- Cole Nussbaumer Knaflic: Storytelling with Data: A Data Visualization Guide for Business Professionals
- Alberto Cairo: The Truthful Art: Data, Charts, and Maps for Communication
- Jason Lankow: Infographics: The Power of Visual Storytelling
- Sandra Rendgen: Understanding the World. The Atlas of Infographics
- Randy Krum: Cool Infographics: Effective Communication with Data Visualization and Design
27. 5. 2020 11:57, Mgr. Martin Večeřa, učo 72839
- Zadáno/změněno 26. 6. 2020 07:50, Alena Dvořáková
- Záznam založen 30. 4. 2020 12:19, Jana Zemanová, učo 9619
- Zveřejnit od 26. 5. 2020 09:01, Helena Kryštofová
- Práce převzata 26. 5. 2020 09:01, Helena Kryštofová
 angličtina
Práce na příbuzné téma
Seznam prací, které mají shodná klíčová slova.
-
User interface for BricksLLM proxy
Ing. Daniel Olearčin, učo 553669 -
Patrolling Games Map Editor
Ing. Petr Balnar -
Automatizace regresního testování webové aplikace
Mgr. Dávid Chmurčiak, učo 143240 -
Web-based user interface to Podman
Bc. Martin Šafář -
Empaia-compliant WSI Case Viewer for xOpat
Bc. Adam Bujdák -
Use of continuous integration in web application development
Mgr. Martin Mráz -
Front-end webové aplikace pro výuku programování
Mgr. Adam Král -
Analýza a tvorba groupware pro studentské projekty
Mgr. Vojtěch Pilař
Složky
Soubory
-
Přidání souboru
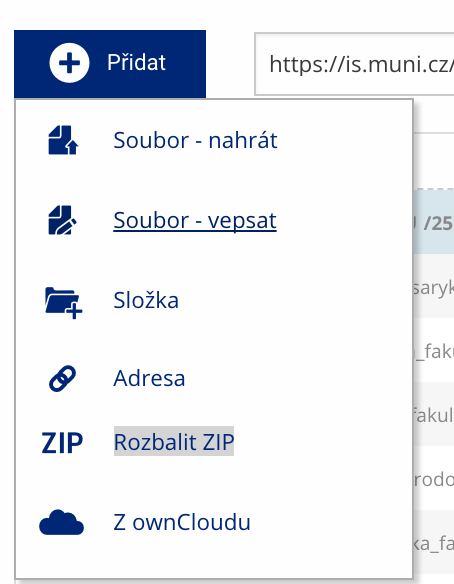 Soubor nebo složku lze nahrát pomocí tlačítka Přidat.
 -
Další operace se soubory
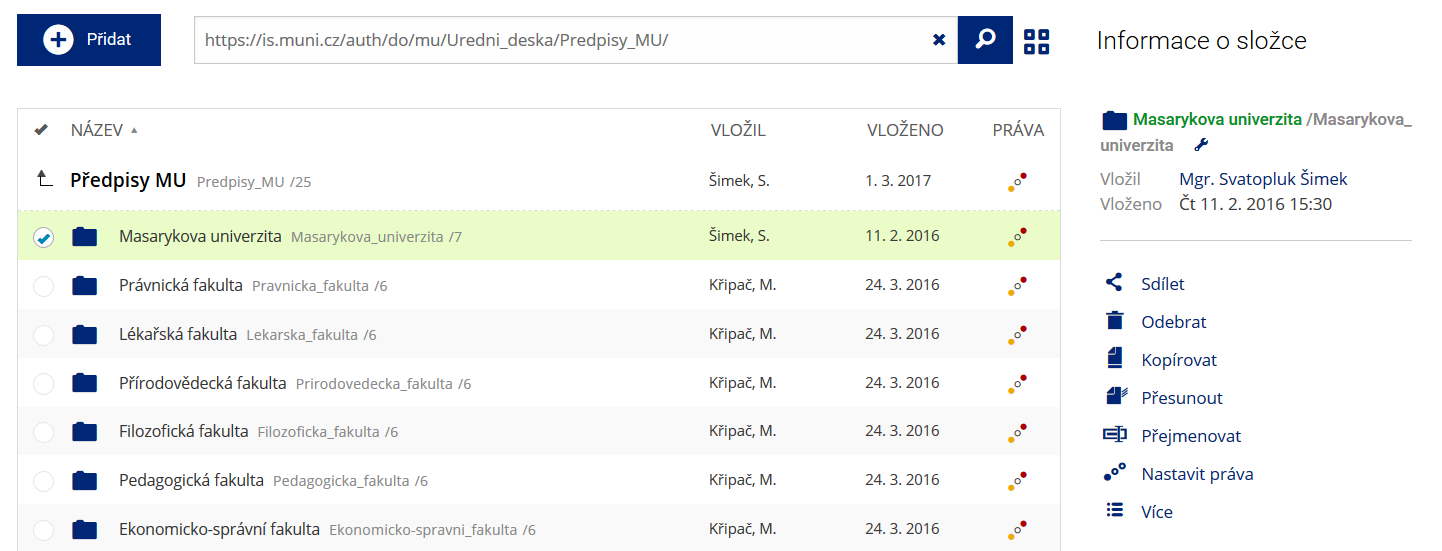 Podrobnosti lze zjistit označením příslušného řádku.
 -
Pohled pro experty
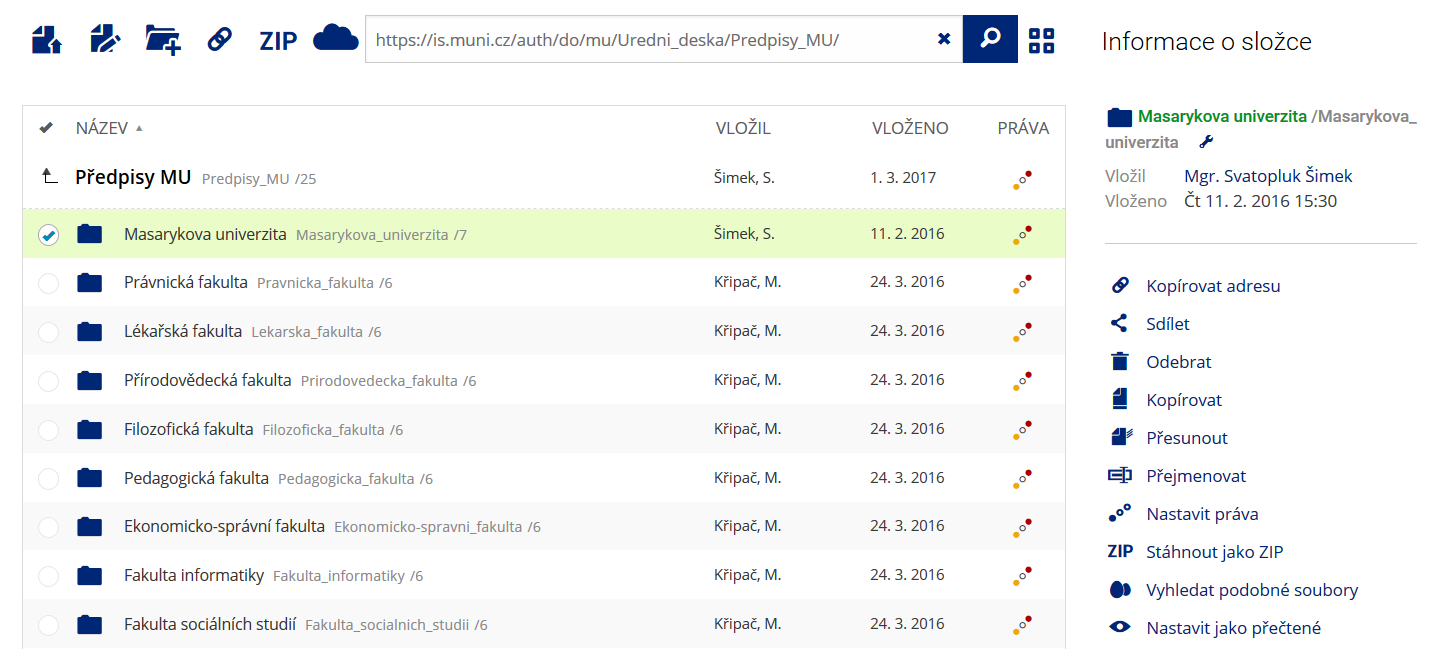 Pro častou práci je možné zvolit režim Více možností.
 -
Vyhledávání souborů
 Vyhledávaný výraz můžete zadat přímo do adresního řádku.
 -
Rychlý přístup k souborům
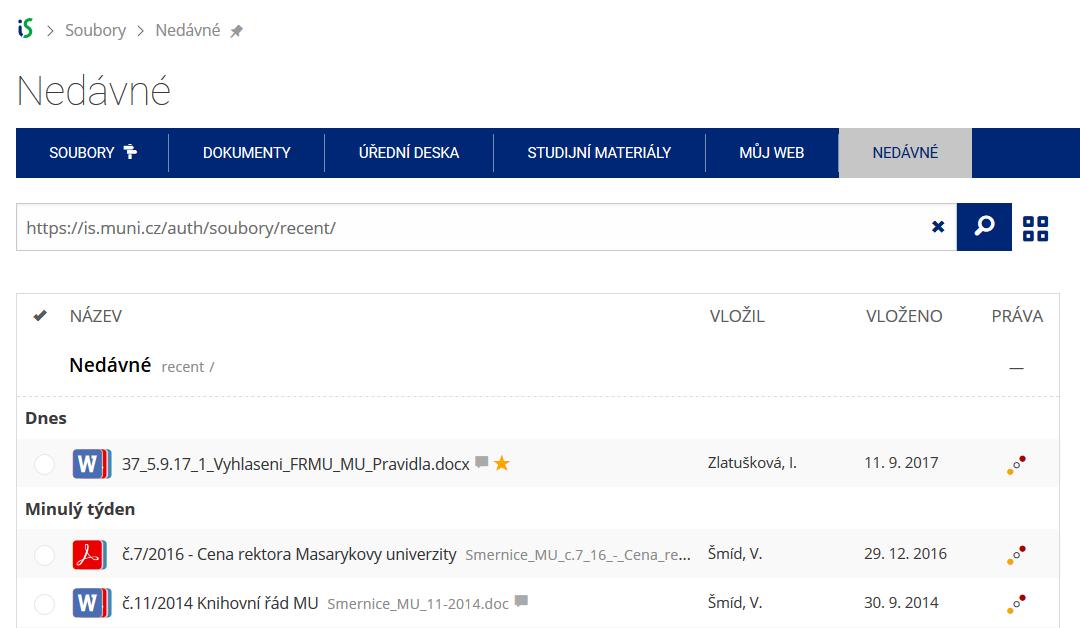 Pomocí funkce Nedávné je možné se rychle vrátit k právě prohlíženým souborům. Oblíbené soubory je také možné označit Hvězdičkou.